Skip to content

Indiana Labor Market Review – August 2026

August 14, 2026

Specialized Staffing

Economic Growth Region 2

Statistical Data Report for June 2026, Released August 2026

State Employment and Unemployment

Unemployment rates were lower in June in 8 states, higher in 2 states, and stable in 40 states and the District of Columbia, the U.S. Bureau of Labor Statistics reported. Thirteen states had jobless rate increases from a year earlier, 7 states had decreases, and 30 states and the District had little change. The national unemployment rate, 4.2 percent, changed little both over the month and over the year. 

In June 2026, nonfarm payroll employment increased in 3 states, decreased in 1, and was essentially unchanged in 46 states and the District of Columbia. The job gains occurred in Texas (+43,400, or +0.3 percent), Minnesota (+13,200, or +0.4 percent), and New Hampshire (+4,500, or +0.6 percent). Employment decreased in West Virginia (-9,100, or -1.2 percent). 

Over the year, nonfarm payroll employment increased in 4 states, decreased in 1 state and the District of Columbia, and was essentially unchanged in 45 states. Employment increased in Texas (+177,900, or +1.2 percent), North Carolina (+62,900, or +1.2 percent), Minnesota (+45,900, or +1.5 percent), and Nevada (+36,700, or +2.3 percent). The job losses occurred in Virginia (-43,600, or -1.0 percent) and the District (-36,100, or -4.8 percent).

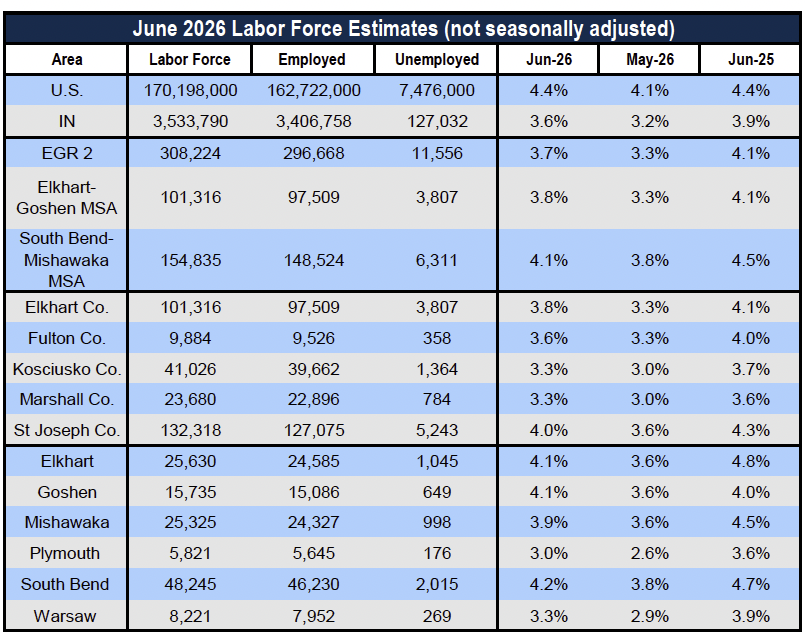
Source: Indiana Department of Workforce Development, Research & Analysis, Local Area Unemployment Statistics | Unemployment Statistics Released:07/24 | Notes: The data displayed are presented as estimates only. The most recent month’s data are always preliminary and are revised when the next month’s data are released

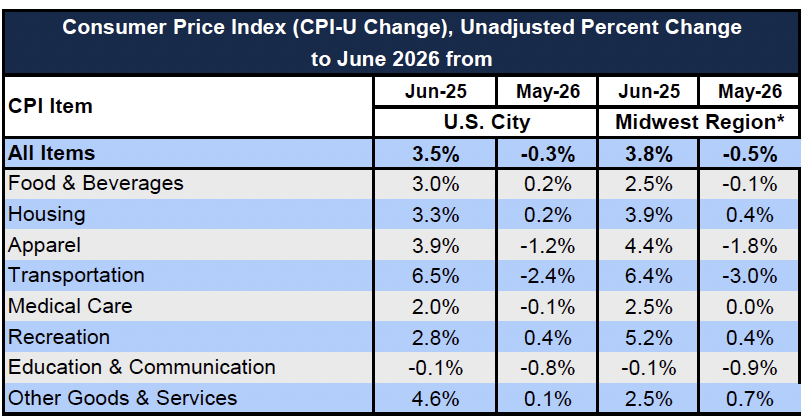
*Midwest region = Midwest Urban Average. Midwest Region includes Illinois, Indiana, Iowa, Kansas, Michigan, Minnesota, Missouri, Nebraska, North Dakota, Ohio, South Dakota and Wisconsin | Source: U.S. Bureau of Labor Statistics

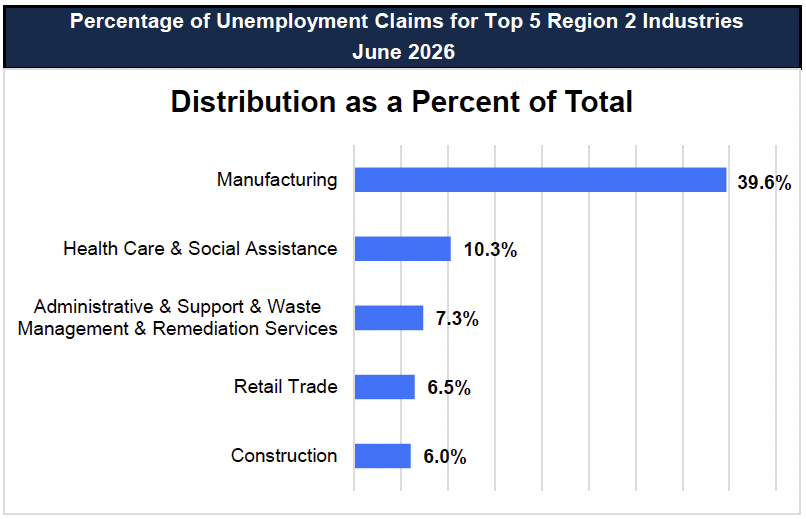
Source: Indiana Department of Workforce Development, Research and Analysis

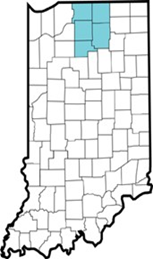
Economic Growth Region (EGR) 2

Elkhart, Fulton, Kosciusko, 
Marshall, and St. Joseph Counties

Unemployment Rates by State
(seasonally adjusted):
June 2026

U.S. – 4.2%

Illinois – 5.1%

Indiana – 3.3%

Kentucky – 4.7%

Michigan – 5%

Ohio – 3.6%

Source: U.S. Department of Labor, Bureau of Labor Statistics

Unemployment Rank by County
(of 92 Counties): June 2026

#7 – St. Joseph (3.6%)

#14 – Elkhart (3.3%)

#32 – Fulton (3.3%)

#60 – Kosciusko (3%)

#62 – Marshall (3%)

Source: Indiana Department of Workforce Development, Research and Development, Local Area Unemployment Statistics

Unemployment Claims: June 2026


REGION 2

Initial Claims

06/06/26 – 498(D)

06/13/26 – 261(D)

06/20/26 – 206(D)

06/27/26 – 277(D)

Continued Claims

06/06/26 – 1,430

06/13/26 – 1,417

06/20/26 – 1,433

06/27/26 – 1,534

Total Claims

06/06/26 – 1,928

06/13/26 – 1,678

06/20/26 – 1,639

06/27/26 – 1,811

STATE OF INDIANA

Initial Claims

06/06/26 – 2,897

06/13/26 – 2,365

06/20/26 – 2,043

06/27/26 – 2,171

Continued Claims

06/06/26 – 18,273

06/13/26 – 18,019

06/20/26 – 18,111

06/27/26 – 17,890

Total Claims

06/06/26 – 21,170

06/13/26 – 20,384

06/20/26 – 20,154

06/27/26 – 20,061

*Total State of Indiana Claims not released for May.

Notes: (D) Indicates one or more counties are excluded due to non-disclosure issues | Numbers subject to weekly revision |Source: Indiana Department of Workforce Development, Research and Analysis

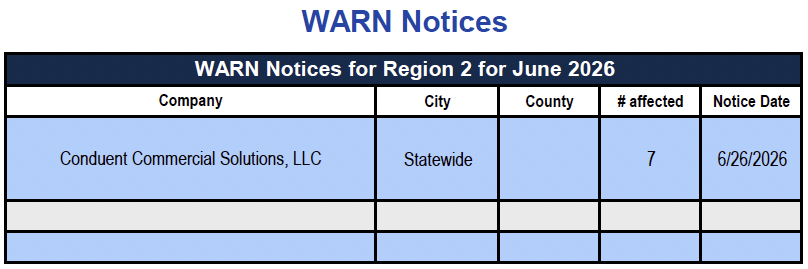
Source: Indiana Department of Workforce Development, WARN Notices | For information on WARN Act requirements, you may go to the U.S. Department of Labor Employment Training Administration Fact Sheet:

https://www.doleta.gov/programs/factsht/warn.htm

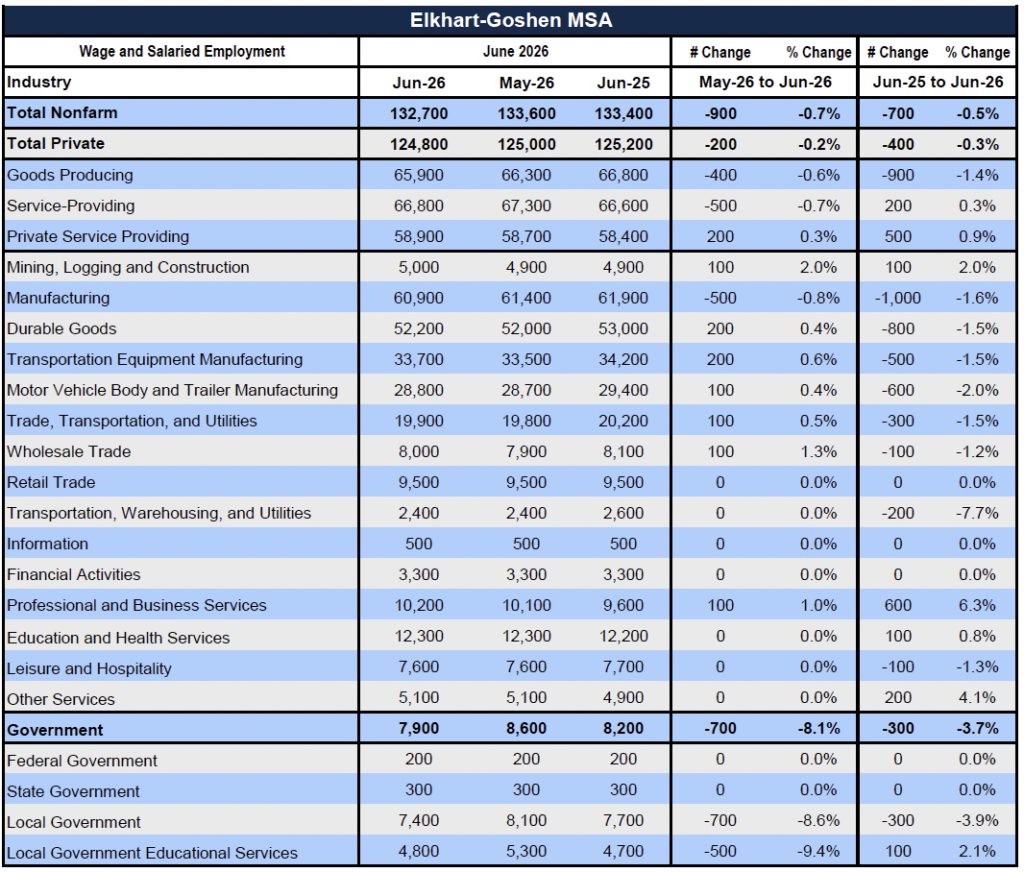
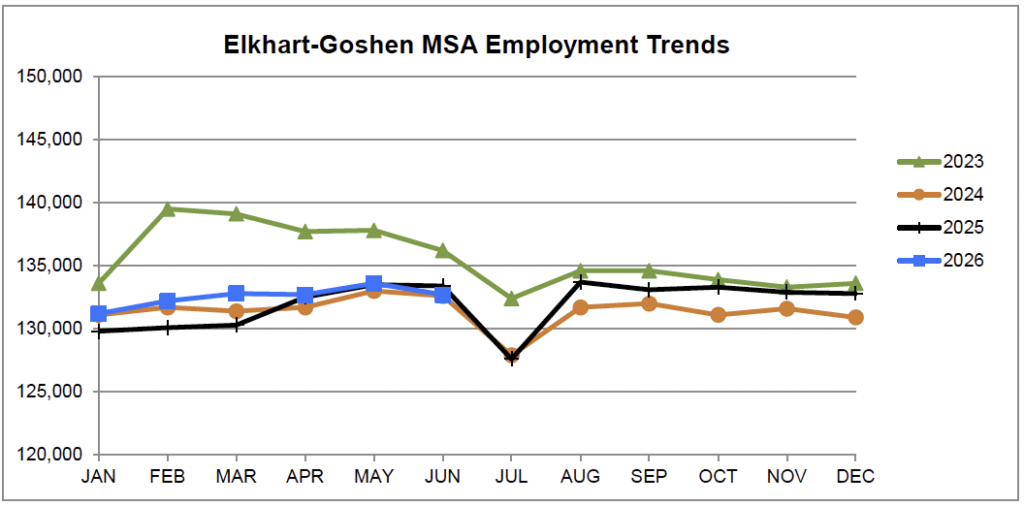
Elkhart-Goshen MSA Trends

Source: Indiana Dept of Workforce Development, Research and Analysis, Current Employment Statistics

Source: Indiana Department of Workforce Development, Research & Analysis, Current Employment Statistics | Note: Historical data for the most recent 4 years (both seasonally adjusted and not seasonally adjusted) are revised near the beginning of each calendar year, prior to the release of January estimates for statewide data.

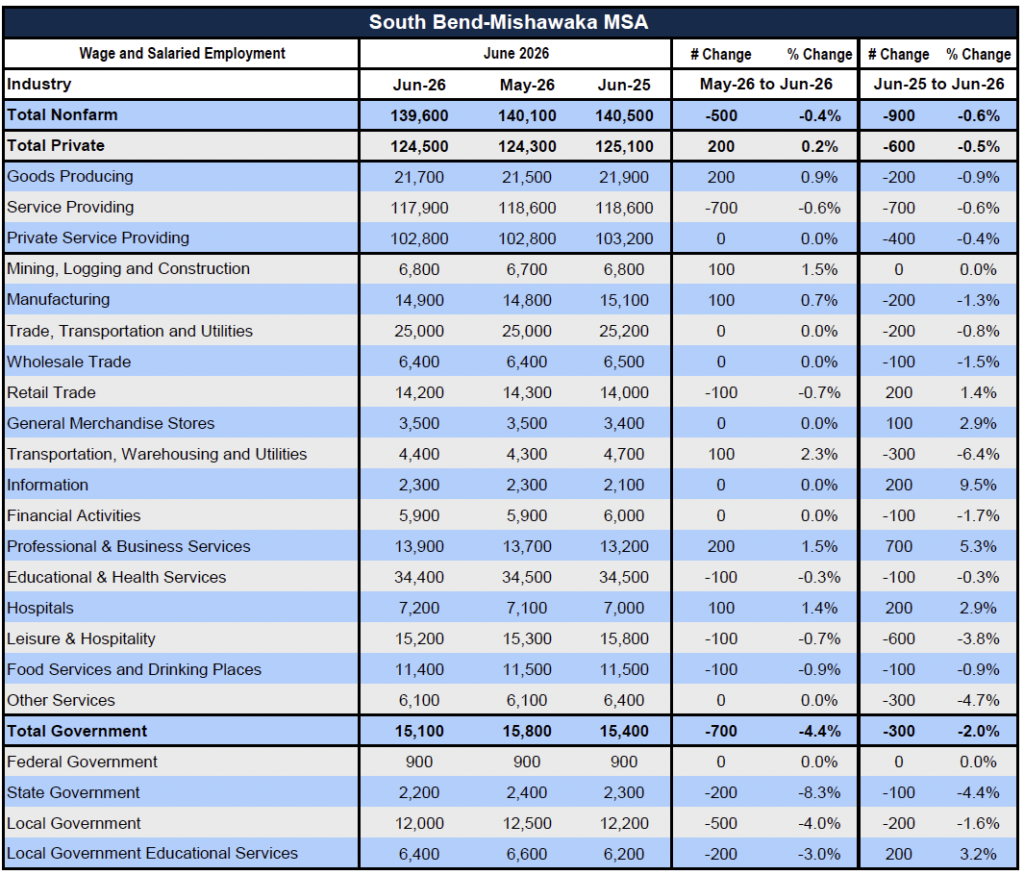
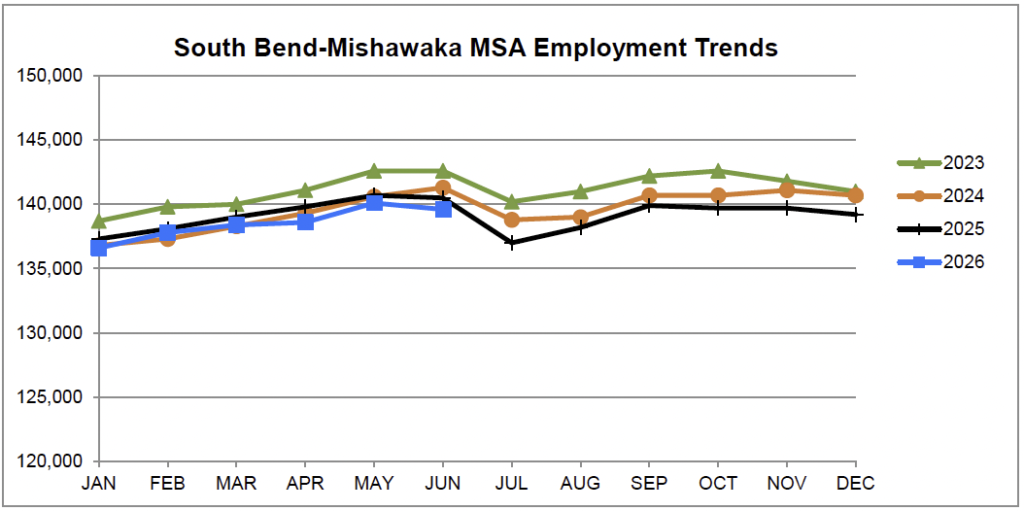
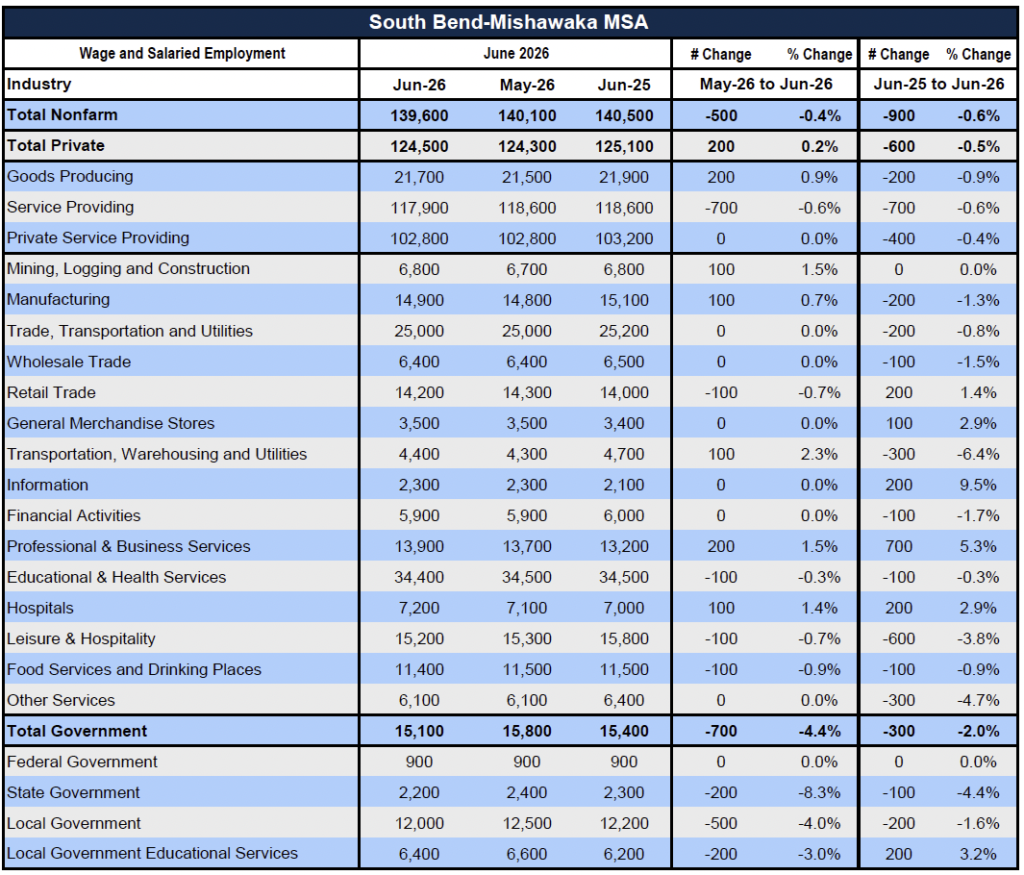
South Bend-Mishawaka MSA Trends

Source: Indiana Dept of Workforce Development, Research and Analysis, Current Employment Statistics

Source: Indiana Department of Workforce Development, Research & Analysis, Current Employment Statistics | Note: Historical data for the most recent 4 years (both seasonally adjusted and not seasonally adjusted) are revised near the beginning of each calendar year, prior to the release of January estimates for statewide data.

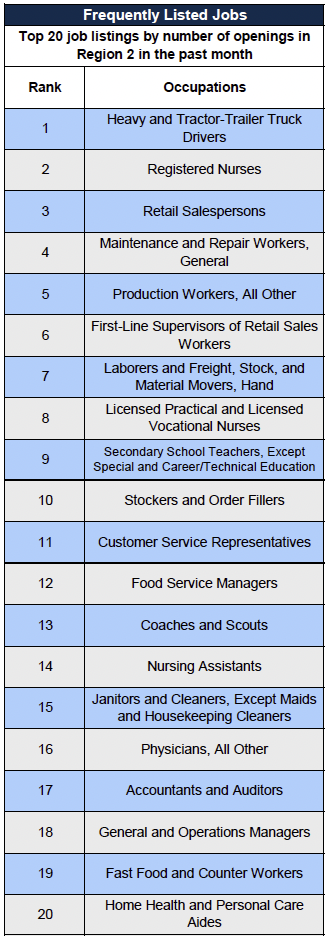
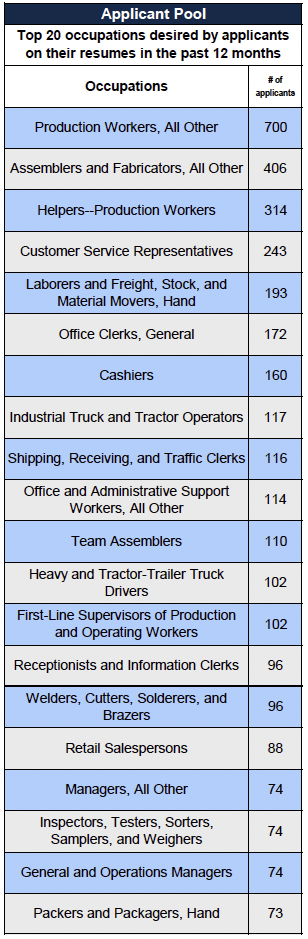
Statewide Occupation Trends

Source: Indiana Workforce Development, Indiana Career Connect

Source: Indiana Workforce Development, Indiana Career Connect

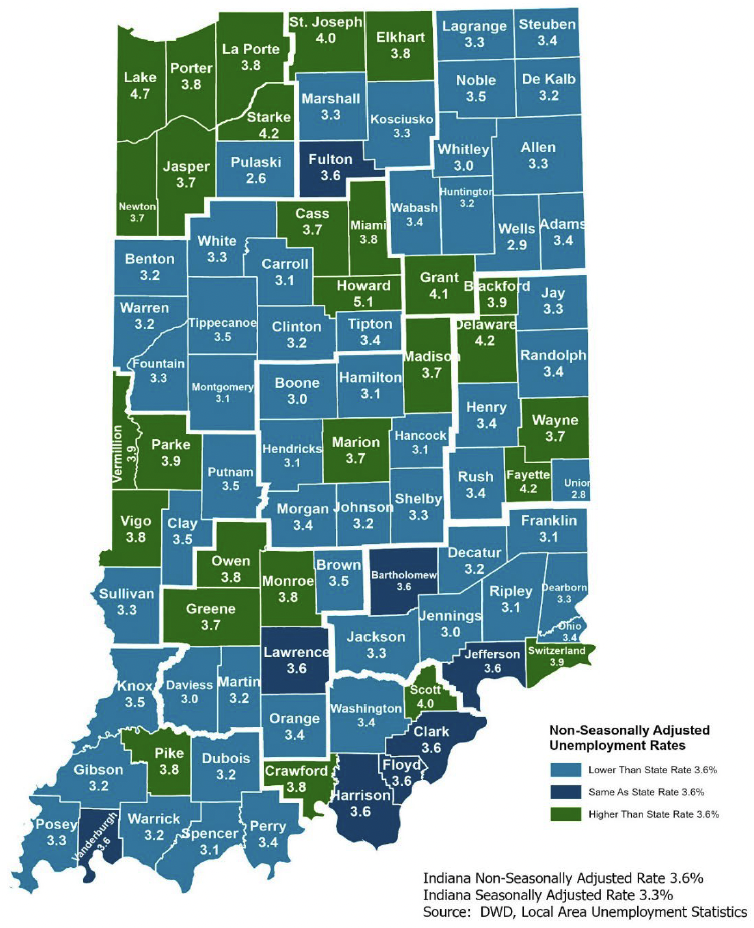
Indiana

County Unemployment Rates
June 2026

Questions?

Please contact the DWD Representative below:

Kathy Jaworski
Regional Labor Analyst
Research and Analysis

Indiana Department of Workforce Development
(219) 841-6347
kjaworski@dwd.in.gov

Disclaimer

All information reported was provided by the Indiana Department of Workforce Development.  The Indiana Labor Market Review is published monthly and can be obtained by contacting your DWD Representative

Share This: