Michigan Labor Market Review
June Data - August Reporting
A RESOURCE PROVIDED FOR EMPLOYERS IN THE GREATER MICHIANA AREA
Michigan Unemployment Rate Stable in June
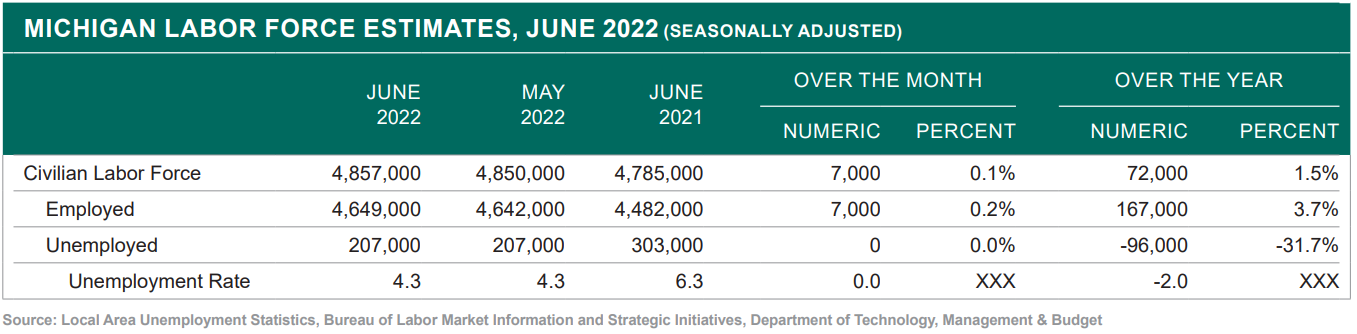
Michigan’s seasonally adjusted jobless rate was unchanged for the third consecutive month in June, remaining at 4.3 percent since April.
The June national unemployment rate was unchanged for the fourth consecutive month at 3.6 percent. Michigan’s June jobless rate was 0.7 percentage points above the national rate. The U.S. jobless rate was reduced by 2.3 percentage points over the year. Michigan’s unemployment rate receded by 2.0 percentage points since June 2021.
Michigan’s labor force was nearly unchanged over the month, edging up by 0.1 percent. The national workforce decreased by 0.2 percent over the same period. Employment in the state rose by 0.2 percent over the month while the U.S. employment total fell by 0.2 percent. Unemployment in the state was unchanged in June and the national unemployment level fell by 0.6 percent since May.
Michigan employment advanced by 3.7 percent over the year while the U.S. employment level rose by 4.3 percent. Since June 2021, statewide unemployment was reduced by 31.7 percent and national total unemployment fell by 37.8 percent.
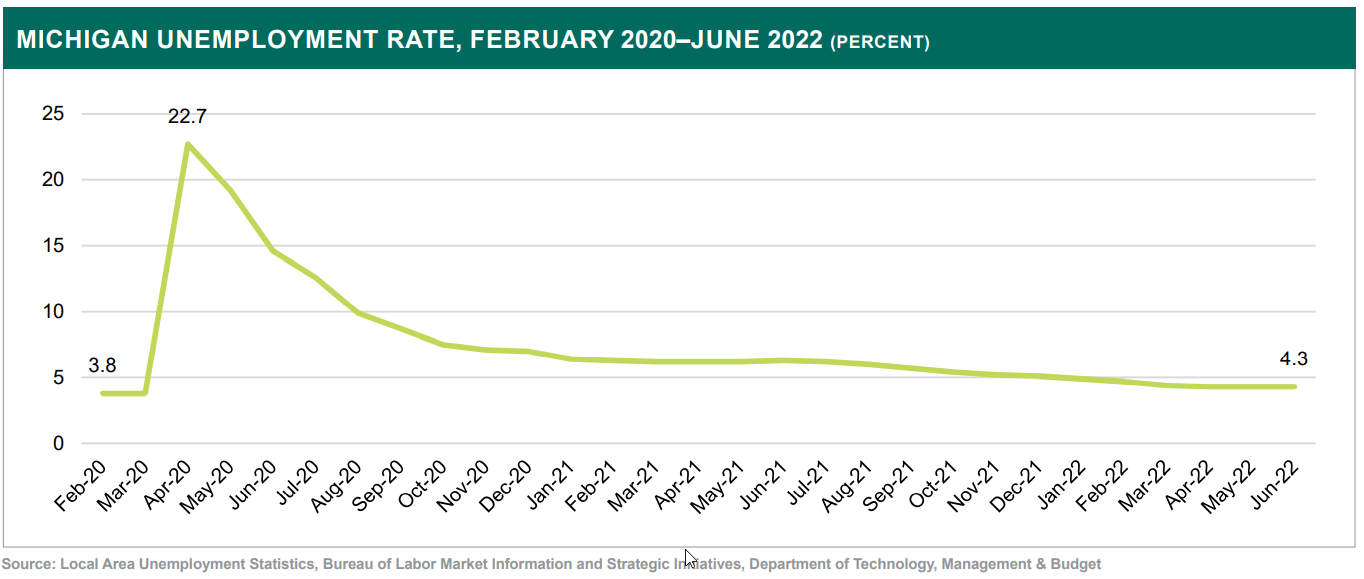
Michigan’s June 2022 jobless rate of 4.3 percent was five-tenths of a percentage point larger than the February 2020 pre-pandemic rate of 3.8 percent.
Michigan Quarterly Jobless Rate Continues Downward Trend in Second Quarter of 2022
An analysis of the average quarterly jobless rate from the first quarter of 2020 to the second quarter of 2022 demonstrates the downward trend in jobless rate since the height of the pandemic in the second quarter of 2020.
Michigan’s 2020 quarter 1 average jobless rate of 3.8 percent was the lowest quarterly jobless rate observed in the state since the year 2000. The statewide quarterly rate surged by 14.9 percentage points to 18.7 percent during the second quarter of 2020 because of the SHIBANI PUTATUNDA Economic Specialist pandemic’s impact on Michigan’s labor market. This was the largest three-month average jobless rate observed in the entire history of the series.
The statewide quarterly jobless rate continued to trend downward in the remaining months of 2020 and the start of 2021, culminating in a three-month average rate of 6.3 percent during the first quarter of 2021. The quarterly unemployment rate remained at 6.3 percent during the second quarter, before continuously declining for the rest of 2021 and the first two quarters of 2022. Michigan’s 2022 quarter 2 unemployment rate of 4.3 percent was 14.4 percentage points below the quarterly rate observed during the second quarter of 2020.
Shibani Putatunda
Economic Specialist
STATE OF MICHIGAN | DEPARTMENT OF TECHNOLOGY, MANAGEMENT, AND BUDGET | BUREAU OF LABOR MARKET INFORMATION AND STRATEGIC INITIATIVES

Michigan Job Trends by Industry Sector
Monthly Overview
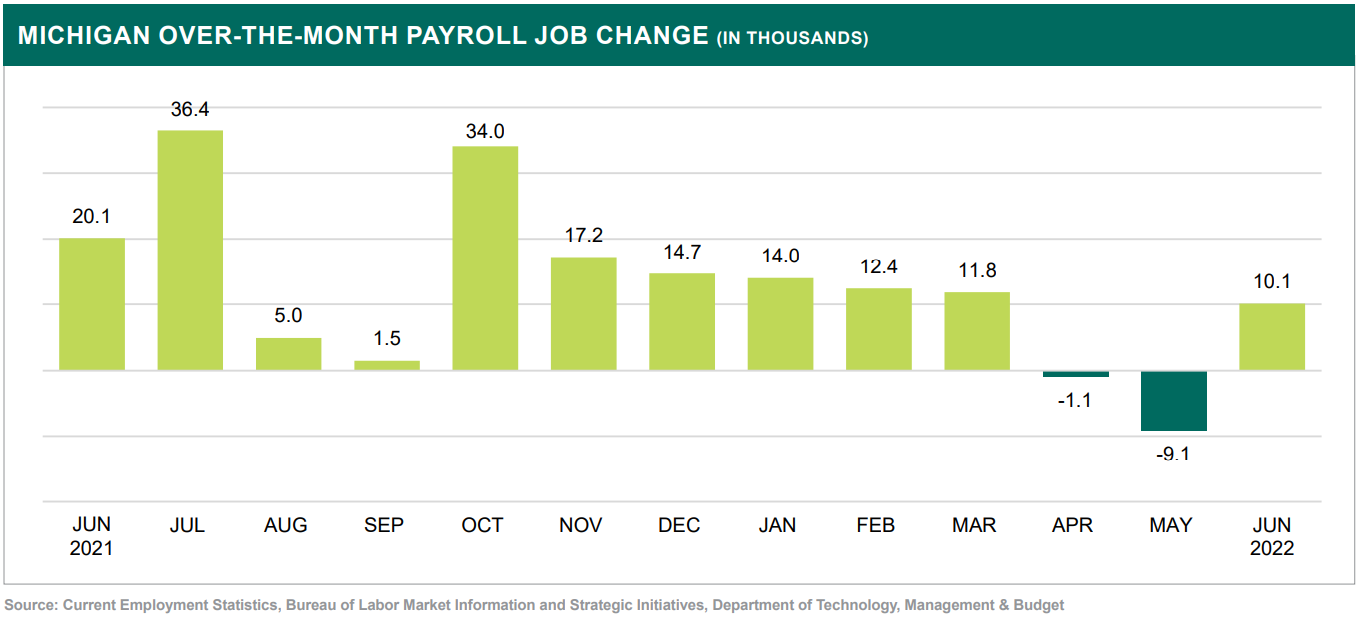
On a seasonally adjusted basis, total nonfarm payroll jobs on the statewide level rebounded by 10,100 or 0.2 percent over the month to 4,327,100 in June. The job gains this month offset the payroll job losses that occurred in April and May. Seasonally adjusted total nonfarm jobs have now advanced fifteen of the past eighteen months in Michigan. However, as of June 2022, nonfarm employment on the statewide level remained 125,600 or 2.8 percent lower than its February 2020 pre-pandemic level.
Nationally, seasonally adjusted jobs also moved up 0.2 percent in June, marking the 18th consecutive month of job growth across the nation. Like Michigan, total nonfarm jobs for the United States continued to remain below (-0.3 percent) their February 2020 pre-pandemic level.
Seven of Michigan’s 11 major industry sectors recorded seasonally adjusted job gains during June. On a numeric level, seasonally adjusted employment additions were led by the Professional and business services (+7,300), Manufacturing (+3,600), and financial activities (+2,800) sectors. Several industries recorded job declines over the month in June including the Government (-5,700), Leisure and hospitality (-2,200), and Construction (-1,200) sectors. On a percentage basis, two major industry sectors noted basically no job change during June, which included the Trade, transportation, and utilities and Education and health services sectors. Jobs have continued to rebound since the onset of the COVID-19 pandemic, which began during the early part of 2020. Furthermore, on a seasonally adjusted basis, numerous major industry sectors and subsectors have now reached or surpassed their February 2020 job levels. Currently, the Mining and logging (+10.0 percent), Financial activities (+3.5 percent), Information (+2.0 percent), Professional and business services (+1.0 percent), and Trade, transportation, and utilities (+0.2 percent) sectors have all surpassed their February 2020 job totals.
Over The Year Analysis
Since June 2021, Michigan total nonfarm payroll jobs have increased by 146,900 or 3.5 percent, eight-tenths of a percentage point behind the national rate of change (4.3 percent), during the same time period. Every major industry sector in Michigan, other than Construction (-0.7 percent), has recorded job growth over the year. On a percentage basis, noteworthy job gains were recorded within several industries including the Mining and logging (+14.9 percent), Information (+9.9 percent), Leisure and hospitality (+8.2 percent), and Other services (+5.9 percent) sectors. Both the Government and Education and health services sectors remained mostly unchanged during this time period
Major Industry Sector job Share in Michigan and the United States
Comparing industry level jobs on a quarterly basis proves revelatory when evaluating how certain industries fared during specific timeframes. As of the second quarter of 2022, total nonfarm payroll jobs on the statewide level remained 2.7 percent below the 2019 second quarter total nonfarm job level.
In contrast, on the nationwide level, total nonfarm payroll jobs were 0.6 percent above the 2019 second quarter level. Although the United States outpaced Michigan on the total nonfarm level as well as in job recovery within several major industry sectors, it is important to note that Michigan (-23.7 percent) lost a significantly greater share of total jobs between February and April 2020 than did the United States (-14.4 percent).
As the table displays, five major industry sectors in Michigan had quarterly job levels equal to or greater than their second quarter 2019 levels. During this same time frame, the United States recorded seven major industries that equaled, or surpassed, their second quarter 2019 job levels. Additionally, three of the five abovementioned statewide major industry sectors (Mining and logging, Construction, and financial activities) fully recovered, then proceeded to gain more jobs on a percentage basis than the same industry did on the national level.

Significant Industry Employment Developments
PROFESSIONAL AND BUSINESS SERVICES
The Professional and business services sector moved up in June by 7,300 or 1.1 percent to 661,600, on a seasonally adjusted basis. In Michigan, total jobs within this industry have increased four of the past six months. Employment additions were recorded in all three of the major industry’s seasonally adjusted subsectors. Led by the Administrative and support and waste management (+5,000) subsector, gains were also noted within Professional, scientific, and technical (+2,000) and Management of companies (+300). Over the year, total jobs within Professional and business services increased by 34,300 or 5.5 percent. Additionally, this industry was one of five major industry sectors in Michigan to surpass its February 2020 pre-pandemic job level (+1.0 percent). On the national level, Professional and business services advanced by 74,000 or 0.3 percent over the month and was up 4.1 percent above its February 2020 pre-pandemic level.
MANUFACTURING
Seasonally adjusted jobs in the Manufacturing sector increased by 3,600 or 0.6 percent to 605,300 during June. On the statewide level, total employment within this industry has risen only twice in the past six months. However, job additions this month were recorded in both of this major industry’s subsectors: Durable (+2,200) and Nondurable goods (+1,400). The rise within the Durable goods subsector was mainly due to auto-related rebounds within Transportation equipment manufacturing (+2,400). Since June 2021, total jobs within the Manufacturing sector advanced by 29,800 or 5.2 percent. Despite this yearly gain, employment within this major industry sector remained 2.3 percent below its February 2020 pre-pandemic level. Nationally, seasonally adjusted Manufacturing jobs rose by 29,000 or 0.2 percent over the month and unlike Michigan, surpassed its February 2020 job level (+0.1 percent).
FINANCIAL ACTIVITIES
On a seasonally adjusted basis, total jobs within the financial activities sector increased by 2,800 or 1.2 percent over the month to 237,500 in June. This marks the fourth time in the past six months that jobs have risen within this statewide major industry sector. Seasonally adjusted job additions were also recorded within both of the industry’s subsectors: Real estate and rental and leasing (+1,700) and Finance and insurance (+1,100) during June. Over the year, total jobs within the financial activities sector moved up by 5,300 or 2.3 percent. This sector has also surpassed its February 2020 pre-pandemic job level (+3.5 percent). Nationally, employment within this major industry sector increased by +1,000 over the month and was 0.9 percent above its February 2020 job level.
Metropolitan Statistical Areas (MSAs)
For the second consecutive month, 10 of Michigan’s 14 Metropolitan Statistical Areas (MSAs) recorded a total nonfarm payroll job gain. On a not seasonally adjusted basis, only three of those 10 metro areas noted a job change greater than Michigan. However, when compared to the nation (+0.6 percent), total nonfarm jobs in eight of Michigan’s 14 metro areas recorded an over the month percent increase larger than, or equal to, the United States. Two regions, Ann Arbor and Lansing, recorded total payroll job declines during June. On a percentage basis, both Jackson and Bay City displayed no job change since May 2022.
Over the year, all of Michigan’s 14 metro areas recorded not seasonally adjusted job gains. Notable advancements occurred within the Detroit MSA (+5.0 percent), Ann Arbor (+4.3 percent), and Muskegon (+4.1 percent). Only two Michigan regions moved up by less than one percent over this time period: Flint (+0.9 percent) and Saginaw (+0.5 percent). Additionally, the Detroit, Ann Arbor, and Muskegon MSAs all recorded percent increases greater than the nationwide rate of change over this same time.
Employment within the Mining, logging, and construction; Trade, transportation, and utilities; Professional and business services; and Leisure and hospitality major industry sectors moved up over the month in virtually every metro area in Michigan during June. Opposite the above-mentioned industries, job declines were noted in a majority of region’s Government sectors.
Total nonfarm payroll jobs in four Michigan metro areas have now surpassed their February 2020 pre-pandemic job levels. Led by Muskegon (+1.9 percent) and Bay City (+1.4 percent), not seasonally adjusted payroll jobs in both Midland (+1.1 percent) and the Detroit MSA (+0.4 percent) have also exceeded their February 2020 total nonfarm levels.
JIM BIRNEY
Economic Analyst


Jackson Metropolitan Area
Overview
- In June, the Jackson metro area unemployment rate increased by 0.6 percentage points to 5.0 percent.
- Over the year, total workforce in the region moved up by 1.8 percent (+1,300) due to an increase in the total number of employed persons in the area.
Monthly Industry Developments
- Total nonfarm payroll employment within the Jackson MSA stayed unchanged in June, residing at 57,800 for the second consecutive month.
- Regional nonfarm employment remained 1,700 or 2.9 percent lower than its 2019 job level.
Industry Trends
- Typical seasonal job declines were recorded in the Government industry sector, as jobs fell by 200 or 2.6 percent over the month.
Kalamazoo-Portage Metro Area
Overview
- Over the month, the Kalamazoo MSA jobless rate increased by 0.5 percentage points to 4.6 percent, slightly below the statewide monthly rate (4.8 percent).
- Since June 2021, total workforce in the region advanced by 2.1 percent due to gains in the total number of employed (+5,900) persons.
Monthly Industry Developments
- Nonfarm employment in the Kalamazoo metro area rose by 800 or 0.5 percent in June to 147,600, notably lower than the statewide (+1.2 percent) rate of change this month.
- Regional Trade, transportation, and utilities jobs decreased by 100 or 0.4 percent over the month, the first recorded decline in June within this industry in the past 10 years
Industry Trends
- In June, both the Manufacturing (+300) and Leisure and hospitality (+500) sectors recorded relatively average seasonal job gains.
LANSING - EAST LANSING METRO AREA
Overview
- The jobless rate in the Lansing MSA remained unchanged for the second consecutive month, residing at 4.7 percent.
- Total labor force in the region fell by 2.1 percent over the month, the largest percent decline recorded among Michigan metro areas.
Monthly Industry Developments
- Since May 2022, total nonfarm jobs in the Lansing MSA moved down by 0.8 percent to 225,800, the largest percent decline recorded this month among Michigan’s 14 metro areas
- Regional Manufacturing jobs in Lansing rebounded by 1,400 or 7.4 percent in June, mainly due to auto-related recalls in the area
Industry Trends
- Typical seasonal job declines were recorded in the Government industry sector, as jobs fell by 200 or 2.6 percent over the month.
MIDLAND METROPOLITAN AREA
Overview
- The Midland labor market jobless rate increased by 0.7 percentage points in June to 4.8 percent, down 0.8 percentage points since its year-ago level.
- Over the year, workforce in the region moved up by 2.6 percent (+1,000) due mainly to an increase in the total number of employed persons.
Monthly Industry Developments
- Midland nonfarm payroll employment rose over the month (+300 or 0.8 percent) to 36,800 and was up 1.9 percent since year-ago levels.
- Despite recent job gains, total nonfarm jobs in Midland remained 1,400 or 3.7 percent lower than its June 2019 level.
Industry Trends
- Private service providing jobs increased by 0.8 percent to 25,400 in June, up by 1.2 percent since June 2021.
MONROE METROPOLITAN AREA
Overview
- In June, the Monroe region unemployment rate rose by 1.0 percentage point to 5.6 percent, the largest recorded percent increase among all Michigan metro areas this month.
- Over the month, the gain in the number of unemployed persons was offset but the decline in the total number of employed persons.
Monthly Industry Developments
- Monroe nonfarm payroll jobs increased by 300 or 0.8 percent over the month to 40,100.
- Total private (+500) jobs advanced relatively more than normal in Monroe during June, due partially to a slightly stronger-than-average seasonal job gain in the Leisure and hospitality (+4.5 percent) sector.
Industry Trends
- Regional Government jobs fell by 200 or 3.9 percent over the month to 4,900 and was 9.3 percent lower than its June 2019 level.
MUSKEGON METROPOLITAN AREA
Overview
- The unemployment rate in the Muskegon MSA increased by 0.8 percentage points in June, to 6.2 percent.
- The total number of unemployed individuals rose by 600 since May 2022, which resulted in a labor force increase of 0.8 percent this month.
Monthly Industry Developments
- Total nonfarm payroll employment within the Muskegon MSA advanced by 1,100 or 1.7 percent over the month to 64,000, up 4.1 percent from year-ago levels.
- The Service providing sector produced the majority of Midland’s June job change, rising by 1,000 or 2.1 percent.
Industry Trends
- Fairly typical seasonal job additions were recorded within the Leisure and hospitality (+700) sector, with total industry jobs now (+100) higher than June 2019.


Niles - Benton Harbor Metro Area
Overview
- The Niles-Benton Harbor unemployment rate advanced by 0.7 percentage points to 5.1 percent during June, 1.4 percentage points below its year-ago level.
- The number of unemployed persons increased by 500 over the month but was down by 1,000 (-21.3 percent) over the year.
Monthly Industry Developments
- Over the month, jobs in the Niles-Benton Harbor labor market increased by 1,000 or 1.7 percent to 64,000, tied with Muskegon for the largest percent increase among Michigan metro areas during June.
- Job additions were recorded in a variety of industries in June, including Mining, logging, and construction (+100); Trade, transportation, and utilities (+200); and Leisure and hospitality (+400).
Industry Trends
- Over the year, total nonfarm payroll jobs have only advanced by 900 or 1.5 percent, the third lowest percent increase among all statewide metro areas.
Saginaw Metropolitan Area
Overview
- During June, the Saginaw MSA jobless rate rose by 0.7 percentage points to 6.5 percent, tied with the Flint region for the highest jobless rate among all Michigan metro areas.
- Workforce in the area stayed mostly unchanged both over the month and over the year.
Monthly Industry Developments
- The Saginaw MSA recorded a total nonfarm job increase of 500 or 0.6 percent this month, rising to 81,300 in June.
- Monthly job gains were recorded in both the Goods producing (+100) and Service providing (+400) sectors.
Industry Trends
- Mining, logging, and construction (+100); Durable goods (+100); and Education and health services (+100) all recorded fairly typical seasonal job additions during June.


Michigan Long-Term Employment Projections, 2020 - 2030
The Michigan Bureau of Labor Market Information and Strategic Initiatives releases long-term employment projections each year. On even-numbered years, such as this one, the bureau releases statewide long-term projections, and on odd-numbered years the bureau releases regional long-term projections. This July, the bureau released the 2020 to 2030 long-term Michigan employment projections. While much of the data in this new set of projections is dominated by the impact that COVID-19 had on the Michigan economy in 2020, long-term demographic trends continue to drive many changes we expect to see in Michigan’s labor market.
Michigan’s population is a major driving force of long-term expectations for economic expansion. Between 2020 and 2030, the total population in Michigan is expected to grow by 4.0 percent. However, all growth is expected to occur among Michiganders age 65 and over, with younger age groups either declining in number or remaining flat over the 10-year period. Consequently, the prime working-age population, ages 25 to 64, is expected to decline by one percent over this period. This decrease translates into a slight expected decrease of 1.2 percent in the number of labor force participants.
Figure 1 shows that a significant decrease in unemployment or increase in population or labor force can all drive increases in employment. While no significant change in population is expected to occur, the additional employment expected to be gained from 2020 to 2030 can be derived from projected decreases in the number of unemployed from the high levels of 2020. This large-scale reemployment is the main driving factor in the employment growth that is expected to take place between 2020 and 2030.
Projections can provide several insights to help businesses and individuals make planning decisions. For example, these projections can be viewed as a constant change over the 10-year period. As such, an occupation that is expected to grow through the end-year of 2030 is also expected to be an occupation with healthy growth through years five, seven, and nine. This information is especially important to those Michiganders seeking to begin a multi-year education or training program, since an occupation expected to grow at a healthy MICHIGAN LONG-TERM EMPLOYMENT PROJECTIONS, 2020–2030 rate throughout the projection period is a positive sign that there will be employment demand when exiting their long-term training or education program.
Top Line Data
Total employment in Michigan is projected to grow 8.8 percent from 2020 to 2030, a rate that can be attributed to the downward push of COVID-19 on Michigan employment in 2020. Michigan is not an outlier among other states in terms of its high expectations of total employment growth over the projection period. Among all states, Michigan ranks 34th for total percentage growth in jobs. So, while this new projected rate of growth is high, it is neither a prediction of a significant divergence from previous trends nor is it an outlier among other states.

Industry Projections
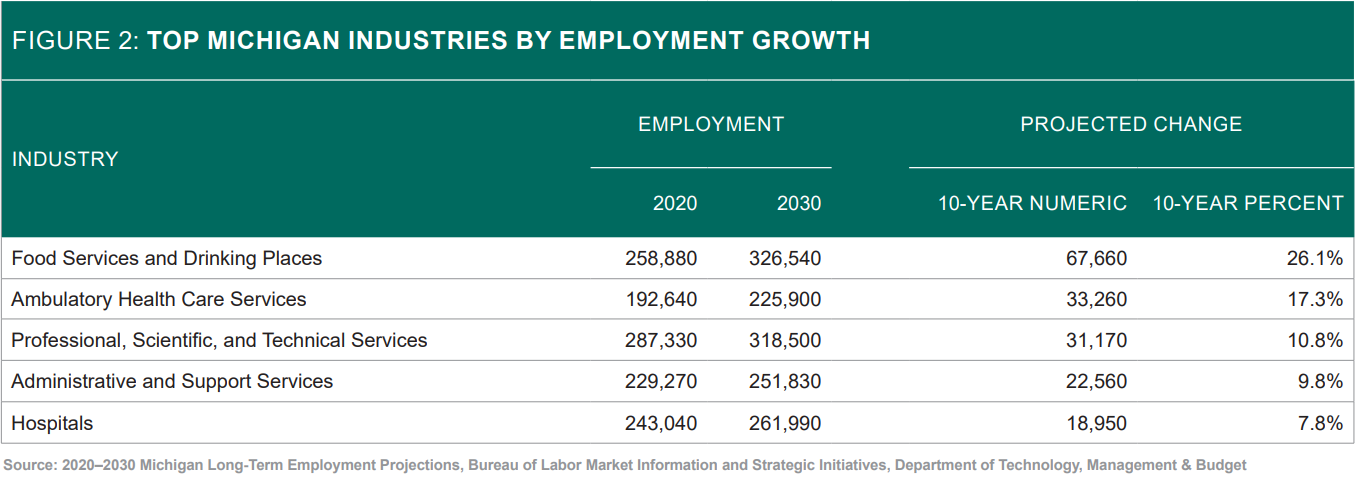
Several Michigan industries stand out for their long-term performance, outside of the effects of COVID-19, on the Michigan economy. Health care and social assistance-related industries, many of which have been steadily growing in Michigan for many years, will be especially important to help take care of Michigan’s aging population in coming years. Education-related industries are another important long-term focus for the state. It is home to numerous high-quality universities, some of which attract many students from outside of the state, effectively making education an important export good in the state’s economy. Additionally, there are a few industries with particularly strong projected growth rates that can be attributed to recovery from the impact of COVID-19 or the impacts of the pandemic itself on consumer habits. Figure 2 displays the top industries by employment growth.
The Ambulatory health care services industry is projected to add about four in 10 new jobs in the Health care and social assistance sector over the 10-year period. This amounts to an additional 33,260 jobs in the industry, or a growth of 17.3 percent. This industry contains many services important to an aging population such as physicians’ and dentists’ offices, outpatient care centers, home health services, and medical and diagnostic laboratories.
Employment in the Social assistance industry is expected to grow at the fastest rate within the Health care and social assistance sector. This 23.9 percent gain in employment is expected to add 17,020 jobs in this industry, which contains services such as Child day care services and Individual and family care services. Services such as these will be important in the future as both the state population ages and obtaining childcare continues to be a challenge for households with a single working parent or two working parents.
Ambulatory health care services and Social assistance industries are some of the fastest[1]growing industries in the Health care and social assistance sector, but Hospitals and Nursing and residential care have also been registering steady increases in employment for many years. Hospitals are expected to add 18,950 jobs over the projection period, or a gain of 7.8 percent. While Hospitals is the slowest growing industry in the sector in terms of percent growth, it is also the largest by employment, and is expected to hold 261,990 jobs at the end of the projection period. Nursing and residential care facilities is expected to add 9,750 jobs from 2020 to 2030, for a total growth of 9.9 percent, a rate above the expected growth rate for total employment in Michigan.
Another sector that stands out for its long-term growth and importance to the future of the Michigan workforce is Educational services. Postsecondary training and education continues to be an important factor in the constitution of a twenty-first century workforce, a fact reflected in the continued projected growth of Colleges, universities, and professional schools and Junior colleges (community colleges). These industries are expected to gain a combined 12,240 jobs over the 10-year period. Elementary and secondary schools, conversely, are expected to grow by just 0.7 percent over the projection period, a level related to the slight 1.5 percent increase in population ages five to 19 over the 2020 to 2030 period. However, this population group is expected to expand more significantly after 2030 and through 2040, meaning projections for employment demand in this industry may shift more positively in coming years.
While healthcare and education-related industries have been steady centers of growth for total employment in recent years, there are some industries whose projected growth stands out as being mostly or wholly related to recovery from COVID-19. Employment in the Accommodation industry is projected to increase by 13,310, or 45.8 percent, while Food services and drinking places are expected to show recovery gains of 67,660 jobs, or 26.1 percent over the 10-year period. Projected changes in employment are generally assumed to be constant over the projection term, but it is fair to assume these sharp increases in particular may occur quickly due to the unique nature of the 2020 job market.
One sector, Transportation and warehousing, stands out for its relationship with the impacts of COVID-19 on its employment. Two-thirds of the net gain in employment in the Transportation and warehousing sector are expected to be focused within the Truck transportation and Warehousing and storage industries. These two industries account for about 16,200 of the 24,250 jobs projected to be added to the sector over the 10-year period. These two industries, along with Couriers and messengers, appear to be in a position to fortify higher-than-typical gains in employment if the trend of higher direct-to-consumer shipping that accelerated with the COVID-19 pandemic remains in place in years to come.
Occupational Projections
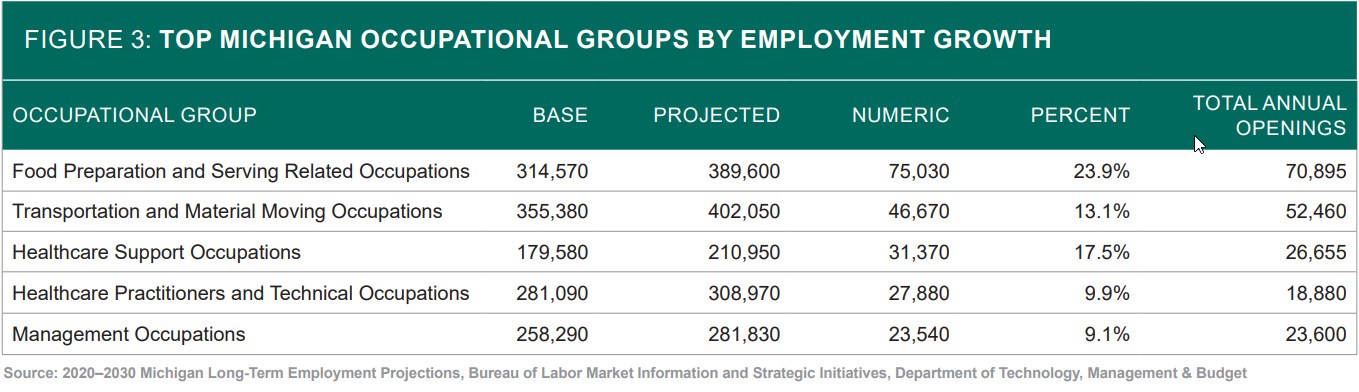
Occupations expected to see the highest growth over the projection period are often closely tied to industries that employ them, such as the case of Health care and social assistance industries and Health care practitioners and technical occupations or skilled trades occupations and Construction-related industries. However, some occupations, such as STEM, can still show strong growth despite not being tied to any particular high growth industry. Figure 3 shows the top occupational groups by employment growth.
Among Healthcare practitioners and technical occupations, Registered nurses, Nurse practitioners, and Physicians assistants have the best mix of projected employment increase, total annual openings, and wages. Registered nurses are projected to increase by 8,150 jobs, or 7.9 percent, over the 10-year period, requiring new entrants to fill 6,300 openings each year. These positions make a median annual wage of $76,710. Nurse practitioners are projected to grow by 2,590 over the period, expanding the occupation by half. An expected 595 openings will need to be filled annually in this occupation, earning a median wage of $102,060. Physicians assistants, another relatively small but quickly growing occupation, is projected to expand by 1,440 jobs, or 31.9 percent. This occupation is expected to require 435 annual openings be filled by entrants, with incumbents currently earning a median wage of $104,810.
Skilled trades occupations are another set of jobs that are expected to show above-average growth over the projection period. As a whole, the group is expected to add 38,590 jobs, or 10.6 percent, bringing the total number of jobs to just under 404,000 by 2030. Some of the top performing occupations in this group are expected to be Industrial machinery mechanics, Electricians, and Machinists. These three occupations are projected to constitute a combined 77,530 jobs in 2030, a gain of 11,390 jobs or 17.2 percent over the 10-year period. A combined 8,045 job openings are expected each year, with a roughly equal number coming from Industrial machinery mechanics, Electricians, and Machinists each.
The roughly 100 occupations described as STEM are expected to grow by 10.9 percent over the projections period, reaching an employment level of 335,000. Many individual STEM occupations are expected to show high growth over the long-term projection period, have many annual openings, and earn higher[1]than-average wages. Engineering occupations such as Industrial engineers, Mechanical engineers, and Civil engineers appear at the top of this list of occupations. Industrial engineers, for example, are expected to grow by 20.4 percent over the 10 years, requiring an average of 2,280 new entrants annually, and currently earn a median annual wage of $80,480.
Many IT-related occupations are also expected to perform highly throughout the projections period, such as Software developers and software quality assurance analysts and testers and Information security analysts. Developers and QA testers are expected to add 8,750 jobs over the projections period, or 22.8 percent, while showing annual average job openings of nearly 4,000 due to occupational transfers and labor force exits. This occupation is reported as two separate job titles in the latest earnings data, with Software developers earning an annual median wage of $98,560 and Software quality assurance analysts and testers earning $78,800.
Another lens through which to view occupational projections is by the amount of education that is typically required to enter a job. Occupations that require at least a bachelor’s degree are expected to grow at the fastest rate, a reflection of past trends. These occupations are expected to grow by about 115,000 jobs, or 9.8 percent, over the 10-year period, the fastest rate among the three broad groups of education that will be examined. Roughly 1,290,000 Michiganders are expected to be employed in this group of occupations by 2030. The count of jobs that require more education than a high school diploma but less than a bachelor’s degree is projected to expand by nearly 40,000, or 8.6 percent by 2030. This group is also the smallest of the three, projected to employ about 500,000 in 2030. The largest group of occupations by over double is the group that requires a high school diploma or less. Projected to hold about 2,860,000 jobs in 2030, this large group is expected to narrowly underperform the Michigan average growth rate over the 10-year period, adding 220,300 jobs or 8.3 percent.
Conclusion
While the impact of COVID-19 on Michigan’s job market is driving much of the expected 8.8 percent growth on Michigan’s total employment levels, many changes can also be found that are driven by other long-term changes in Michigan’s economy. Health care and social assistance and Educational services stand out as industries driving important shifts in Michigan’s occupational structure, and impacts from the COVID-19 pandemic may have accelerated trends in Transportation and warehousing. Beyond changes driven by one particular industry, demand for STEM and skilled trades occupations remain a driver of expected occupational shifts across many industries. These continuing structural changes in occupational demand should be viewed as guidelines for those seeking to enter new occupations throughout the 10-year projection period, not just in 2030, since these structural changes are assumed to be occurring at an even pace throughout the decade.
KEVIN DOYLE
Analytics Manager
Disclaimer
The Above Information was created and disseminated by the Department of Technology, Management, and Budget and the Bureau of Labor Market Information and Strategic Initiatives from the State of Michigan. Specialized Staffing does not hold any rights or ownership to this content. For more information, please contact your Michigan Bureau of Labor Representative.